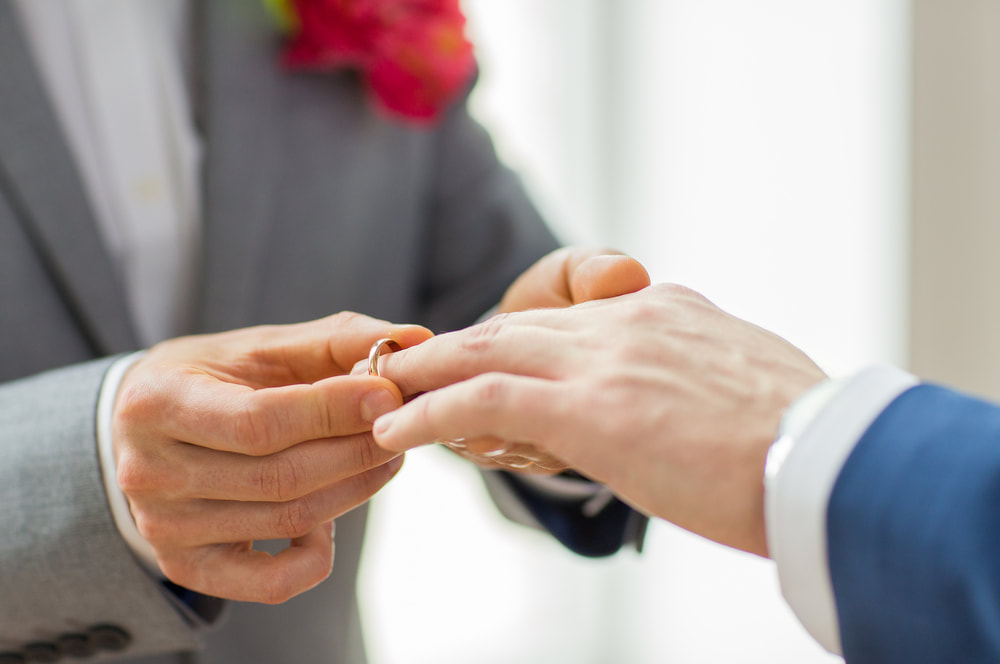
| It is 4 years today since the Australian Parliament changed the Marriage Act (on 9 December, 2017) to allow any adult person to marry any other adult person, regardless of gender or sexual orientation, after 61.6% of Australians voted YES to marriage equality. I thought it would be interesting to look at some statistics about the number of marriages since the law changed, but as Covid-19 changed everything over the last two years these statistics don't tell us a great deal. |
As well as restrictions on numbers of people attending weddings there was also a total ban on weddings (at least in NSW) during the second lockdown. Many couples postponed their weddings, sometimes indefinitely until there is more certainty about restrictions, while others opted for small weddings or elopements.
So while the latest data doesn't give us an accurate picture of marriage trends in Australia, I will share some key figures just for interest, from the recently released numbers from the Australian Bureau of Statistics.
The ABS noted that "while the number of people marrying in 2020 was lower, characteristics such as median age at marriage and the proportion of civil versus religious ceremonies remained comparable with previous years." Civil Celebrants are still performing the vast majority of marriages. In 1902, almost all marriages (97%) were performed by ministers of religion. However, by 2010, more than 80% of marriages were performed by civil celebrants and this trend has been maintained.
So while the latest data doesn't give us an accurate picture of marriage trends in Australia, I will share some key figures just for interest, from the recently released numbers from the Australian Bureau of Statistics.
- There were 78,989 marriages registered in Australia in 2020 compared with 113,815 in 2019. This was a decrease of 30.6%.
- The decrease of 30.6% from 2019 to 2020 is the largest annual decrease in marriages ever reported by the ABS (since 1901) and annual marriage registrations are the lowest reported since 1961 (76,686).
- In 2020 there were 2,902 same-sex marriages - a decrease of 2,605 (47.3%) compared with 2019. Same-sex marriages represented 3.7% of all marriages registered in Australia in 2020. This is down from 2019, when same-sex marriages accounted for 4.8% of all marriages.
- Nationally, more female same-sex couples married (61.4% of all same-sex marriages) than male same-sex couples (38.5%). This was the case across all states and territories.
- For couples in same-sex marriages the median age for males was 37.2 years, and for females it was 35.3 years. Median age for both males and females in same-sex marriages has decreased since 2018.
The ABS noted that "while the number of people marrying in 2020 was lower, characteristics such as median age at marriage and the proportion of civil versus religious ceremonies remained comparable with previous years." Civil Celebrants are still performing the vast majority of marriages. In 1902, almost all marriages (97%) were performed by ministers of religion. However, by 2010, more than 80% of marriages were performed by civil celebrants and this trend has been maintained.

 RSS Feed